Getting Facts data
In this chapter, we will read, write and understand typical Finance, Supply chain datasets in Julia language. These datasets will layout foundations for Finance, Supply Chain Anaytics.
Target Audience: This chapter, is meant for Julia Language consultants, ERP Analysts, IT Developers, Finance, Supply chain, HR & CRM managers, executive leaders or anyone curious to implement data science concepts in ERP space.
Once we understand these datasets, in following chapters, we will create Graphs, Vertices and Edges for data analysis, load actual data into Graphs.P2P.jl package supports these ERP systems data structures.
most of the time, Organizations store these datasets in RDBMS tables, document databases and in some case, actual PDFs, images serve as document data itself.
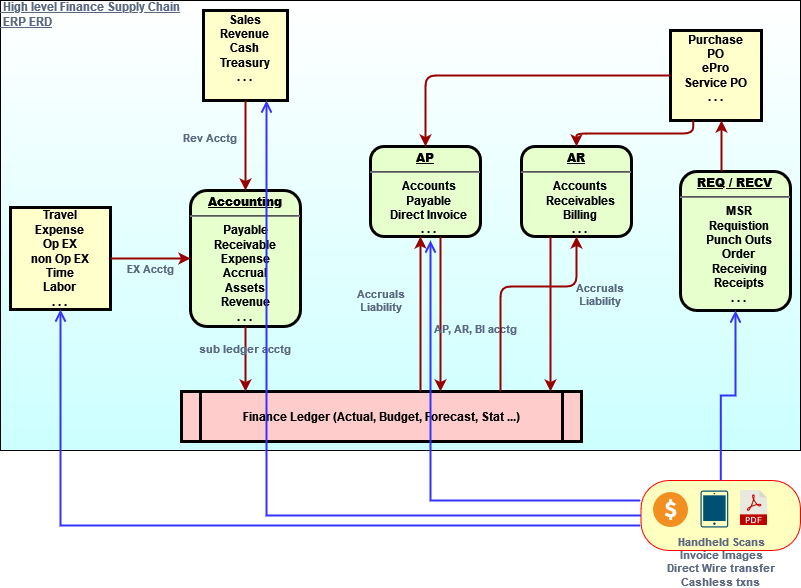
In previous chapter, we saw business process operational workflow diagram and also learned high level physical ERDs.
In this chapter, we will use Julia language and Julia packages to mimic Finance & Supply chain data. Majority of this data is sample data and DOES NOT bear any resemblance to real life data.
at the same time, I am using lots of actual real life data like UNSPSC codes, GUDID, Vendor, Item master data. Also, These datasets are not specific to any particular ERP systems like SAP, Oracle etc.
However, these sample dataset below are very close to real life data sets and are great assets to learn ERP systems architecture.
let's get started.
Background: Most of Enterprise ERP providers like SAP, Oracle, Microsoft build HCM, Finance, Supply Chain, CRM like systems, which store data in highly structured RDBMS tables. Recent advancements in ERP systems also support authoring non-structured data like digital invoices, receipt or hand-held OCR readers.
All of these ERP systems are great OLTP systems, but depend on Analytic systems for creating dashboards, ad-hoc analysis, operational reporting or live predictive analytics.
Further, ERP systems depend on ELT/ELT or 3rd party tools for data mining, analysis and visualizations.
While data engineers use Java, Scala, SPARK based big data solutions to move data, they depend on 3rd party BI Reporting tools for creating dashboards, use Data Mining tools for data cleansing and AI Languages for advance predictive analytics.
When I started learning more about Julia Language, I thought of using Julia Language to solve ERP Analytics multiple languages problem. Why not just use Julia Language to move, clean massive data set as Big data reporting solution, as Julia support multi-threading, distributing parallel computing. Julia language and associated packages has first class support for large arrays, which can be used for data analysis.
and Julia has great visualization packages to publish interactive dashboards, live data reporting.
best of all, Julia is great in numerical computing, advance data science machine learning.
This blog, I am sharing my notes specific to perform typical ERP data analysis using Julia Language.
- About ERP Systems, General Ledger & Supply chain
A typical ERP system consists of many modules based on business domain, functions and operations. GL is core of Finance and Supply chain domains and Buy to Pay, Order to Cash deal with different aspects of business operations in an Organization. Many organization, use ERPs in different ways and may chose to implement all or some of the modules. You can find examples of module specific business operations/processes diagram here.
- General Ledger process flow
- Account Payable process flow
- Tax Analytics
- Sample GL ERD - Entity Relaton Diagram
A typical ERP modules list looks like below diagram.

A typical ERP business process flow looks like below diagram.
A typical GL Balance sheet, Cash-flow or Income Statement looks like this
In this notebook, I will do my best to cite examples from real world data like above mentioned GL Financial statement.
start with Julia
It literally takes < 1 min to install Julia environments on almost any machine.
Here is link to my tutorial, which discuss Julia installation on different machines (including remote and mobile tablets).
adding Packages
using Pkg
Pkg.add("DataFrames")
Pkg.add("Dates")
Pkg.add("CategoricalArrays")
using DataFrames, Dates, CategoricalArrays
Pkg.status()
Resolving package versions...
No Changes to `~/.julia/environments/v1.7/Project.toml`
No Changes to `~/.julia/environments/v1.7/Manifest.toml`
Resolving package versions...
No Changes to `~/.julia/environments/v1.7/Project.toml`
No Changes to `~/.julia/environments/v1.7/Manifest.toml`
Resolving package versions...
No Changes to `~/.julia/environments/v1.7/Project.toml`
No Changes to `~/.julia/environments/v1.7/Manifest.toml`
Status `~/.julia/environments/v1.7/Project.toml`
[336ed68f] CSV v0.10.4
[54eefc05] Cascadia v1.0.2
[324d7699] CategoricalArrays v0.10.6
[8f4d0f93] Conda v1.7.0
[a93c6f00] DataFrames v1.3.4
[31c24e10] Distributions v0.25.64
[e30172f5] Documenter v0.27.19
[8f5d6c58] EzXML v1.1.0
[708ec375] Gumbo v0.8.1
[cd3eb016] HTTP v0.9.17
[7073ff75] IJulia v1.23.3
[c601a237] Interact v0.10.4
[0f8b85d8] JSON3 v1.9.5
[b9914132] JSONTables v1.0.3
[4d0d745f] PDFIO v0.1.13
[c3e4b0f8] Pluto v0.19.9
[2dfb63ee] PooledArrays v1.4.2
[438e738f] PyCall v1.93.1
[88034a9c] StringDistances v0.11.2
[a2db99b7] TextAnalysis v0.7.3
[05625dda] WebDriver v0.1.2
[0f1e0344] WebIO v0.8.18
[fdbf4ff8] XLSX v0.7.10
[ade2ca70] Dates
[8bb1440f] DelimitedFilesrest of this blog, I will assume, all packages are added and imported in current namespace/notebook scope.
# run one command at a time
repeat(["AMIT","SHUKLA"], inner=5) # repeat list/string number of times
fill("34", 4) # repeat list/string number of times
range(1.0, stop=9.0, length=100) # generate n number of equal values between start and stop values
11000:1000:45000 # genarate a range of # from start to finish with set intervals
collect(1:4) # collect funtion collect all values in list
rand([1,2,3,4]) # random value from a list of values
rand(11000:1000:45000) # random value from a list of values
randn() # random # from a list of float values (+ or -)0.6806598133405635using DataFrames, CategoricalArrays
# run one command at a time
# basic dataframe is constructed by passing column vectors (think of adding one excel column at a time)
org = "Apple Inc" # is a simple string
_ap = [1,2] # this is a vector
ap = categorical(_ap) # this is a vector
fy = categorical(repeat([2022], inner=2)) # this is a vector
actuals, budget = (98.40, 100) # this is a tuple
amount = (actuals = 98.54, budget = 100) # this is a named tuple
df_Ledger = DataFrame(Entity=fill(org), FiscalYear=fy, AccountingPeriod = ap, Actuals = actuals, Budget = budget)
# fill(org) or org will produce same results
# run one command at a time
# adding one row at a time, can be done, but is not very efficient
push!(df_Ledger, Dict(:Entity => "Google", :FiscalYear => 2022,
:AccountingPeriod => 1, :Actuals => 95.42, :Budget => 101))
push!(df_Ledger, Dict(:Entity => "Google", :FiscalYear => 2022,
:AccountingPeriod => 2, :Actuals => 91.42, :Budget => 99))4 rows × 5 columns
| Entity | FiscalYear | AccountingPeriod | Actuals | Budget | |
|---|---|---|---|---|---|
| String | Cat… | Cat… | Float64 | Int64 | |
| 1 | Apple Inc | 2022 | 1 | 98.4 | 100 |
| 2 | Apple Inc | 2022 | 2 | 98.4 | 100 |
| 3 | 2022 | 1 | 95.42 | 101 | |
| 4 | 2022 | 2 | 91.42 | 99 |
create Finance Data model
Chart of accounts (organized hierarchy of account groups in tree form), Location/Department or Product based hierarchy allows businesses to group and report organization activities based on business processes.
These hierarchical grouping help capture monetary and statistical values of organization in finance statements.
To create Finance Data model and Ledger Cash-flow or Balance Sheet like statements, We need associated dimensions (chartfields like chart of accounts).
We will discuss how to load actual data from CSV or RDBMS later. We will also learn how to group and create chartfield hierarchies later.
But for now, first Let's start with creating fake ACCOUNT, department and location chartfields.
using DataFrames, Dates
# create dummy data
accountsDF = DataFrame(
    ENTITY = "Apple Inc.",
    AS_OF_DATE=Date("1900-01-01", dateformat"y-m-d"),
    ID = 11000:1000:45000,
    CLASSIFICATION=repeat([
        "OPERATING_EXPENSES","NON-OPERATING_EXPENSES", "ASSETS","LIABILITIES","NET_WORTH","STATISTICS","REVENUE"
                ], inner=5),
    CATEGORY=[
        "Travel","Payroll","non-Payroll","Allowance","Cash",
        "Facility","Supply","Services","Investment","Misc.",
        "Depreciation","Gain","Service","Retired","Fault.",
        "Receipt","Accrual","Return","Credit","ROI",
        "Cash","Funds","Invest","Transfer","Roll-over",
        "FTE","Members","Non_Members","Temp","Contractors",
        "Sales","Merchant","Service","Consulting","Subscriptions"],
    STATUS="A",
    DESCR=repeat([
    "operating expenses","non-operating expenses","assets","liability","net-worth","stats","revenue"], inner=5),
    ACCOUNT_TYPE=repeat(["E","E","A","L","N","S","R"],inner=5));

show("Accounts DIM size is: "), show(size(accountsDF)), show("Accounts Dim sample: "), accountsDF[collect(1:5:35),:]
(nothing, nothing, nothing, 7×8 DataFrame
Row │ ENTITY AS_OF_DATE ID CLASSIFICATION CATEGORY ST ⋯
│ String Dates.Date Int64 String String St ⋯
─────┼──────────────────────────────────────────────────────────────────────────
1 │ Apple Inc. 1900-01-01 11000 OPERATING_EXPENSES Travel A ⋯
2 │ Apple Inc. 1900-01-01 16000 NON-OPERATING_EXPENSES Facility A
3 │ Apple Inc. 1900-01-01 21000 ASSETS Depreciation A
4 │ Apple Inc. 1900-01-01 26000 LIABILITIES Receipt A
5 │ Apple Inc. 1900-01-01 31000 NET_WORTH Cash A ⋯
6 │ Apple Inc. 1900-01-01 36000 STATISTICS FTE A
7 │ Apple Inc. 1900-01-01 41000 REVENUE Sales A
3 columns omitted)There is lot to unpack here in above Julia code and lot is wrong (not best practice for sure).
First, what is a dataframe anyway, think of Julia DataFrame as tabular representation of data arranged in rows and columns. Unlike SQL, you should get into habit of reading and writing one column at a time (not because of reason, you can't read/write rows) for faster performance. Each column is an Array or a list of values, referred as vector.
Above Julia code creates accounts dataframe with columns name as ASOFDATE, DESCR, CATEGORY, ACCOUNT_TYPE, CLASSIFICATION, STATUS.
There are 35 rows, with same ASOFDATE, IDs starting from 11000-45000 in 1000 incremental values, all with STATUS = A (Active), 7 distinct Descriptions and account types (E=Expense, L=Liability, A= Assets, N=Net worth, S=Stats, R=Revenue) repeating 5 times per category.
For 35 rows, it's fine to store data like this, but now is a good time to learn about Categorical and Pooled Arrays, in case when dataframe has millions of rows.
Accounts chartfield
using Pkg, DataFrames, CategoricalArrays, PooledArrays, Dates

# here CLASSIFICATION column vector stores 3500 distinct values in an array
CLASSIFICATION=repeat(["OPERATING_EXPENSES","NON-OPERATING_EXPENSES", "ASSETS","LIABILITIES","NET_WORTH","STATISTICS","REVENUE"
                ], inner=500)

cl = categorical(CLASSIFICATION)
levels(cl)

# using PooledArrays
pl = categorical(CLASSIFICATION)
levels(pl)

# show values in tabular format
# run one command at a time
df = DataFrame(Dict("Descr" => "CLASSIFICATION...ARR...", "Value" => size(CLASSIFICATION)[1]))
push!(df,("CAT...ARR...",size(cl)[1]))
push!(df,("CAT...ARR..COMPRESS.",size(compress(cl))[1]))
push!(df,("POOL...ARR...",size(pl)[1]))
push!(df,("POOL...ARR..COMPRESS.",size(compress(pl))[1]))
push!(df,("CAT...LEVELs...",size(levels(cl))[1]))
push!(df,("POOL...LEVELs...",size(levels(pl))[1]))
push!(df,("CLASSIFICATION...MEMSIZE", Base.summarysize(CLASSIFICATION)))
push!(df,("CAT...ARR...MEMSIZE", Base.summarysize(cl)))
push!(df,("POOL...ARR...MEMSIZE", Base.summarysize(pl)))
push!(df,("CAT...ARR..COMPRESS...MEMSIZE", Base.summarysize(compress(cl))))
push!(df,("POOL...ARR..COMPRESS...MEMSIZE", Base.summarysize(compress(pl))))

first(df,5)

accountsDF = DataFrame(
    ENTITY = "Apple Inc.",
    AS_OF_DATE=Date("1900-01-01", dateformat"y-m-d"),
    ID = 11000:1000:45000,
    CLASSIFICATION=repeat([
        "OPERATING_EXPENSES","NON-OPERATING_EXPENSES", "ASSETS","LIABILITIES","NET_WORTH","STATISTICS","REVENUE"
                ], inner=5),
    CATEGORY=[
        "Travel","Payroll","non-Payroll","Allowance","Cash",
        "Facility","Supply","Services","Investment","Misc.",
        "Depreciation","Gain","Service","Retired","Fault.",
        "Receipt","Accrual","Return","Credit","ROI",
        "Cash","Funds","Invest","Transfer","Roll-over",
        "FTE","Members","Non_Members","Temp","Contractors",
        "Sales","Merchant","Service","Consulting","Subscriptions"],
    STATUS="A",
    DESCR=repeat([
    "operating expenses","non-operating expenses","assets","liability","net-worth","stats","revenue"], inner=5),
    ACCOUNT_TYPE=repeat(["E","E","A","L","N","S","R"],inner=5))
35 rows × 8 columns
| ENTITY | AS_OF_DATE | ID | CLASSIFICATION | CATEGORY | STATUS | DESCR | ACCOUNT_TYPE | |
|---|---|---|---|---|---|---|---|---|
| String | Date | Int64 | String | String | String | String | String | |
| 1 | Apple Inc. | 1900-01-01 | 11000 | OPERATING_EXPENSES | Travel | A | operating expenses | E |
| 2 | Apple Inc. | 1900-01-01 | 12000 | OPERATING_EXPENSES | Payroll | A | operating expenses | E |
| 3 | Apple Inc. | 1900-01-01 | 13000 | OPERATING_EXPENSES | non-Payroll | A | operating expenses | E |
| 4 | Apple Inc. | 1900-01-01 | 14000 | OPERATING_EXPENSES | Allowance | A | operating expenses | E |
| 5 | Apple Inc. | 1900-01-01 | 15000 | OPERATING_EXPENSES | Cash | A | operating expenses | E |
| 6 | Apple Inc. | 1900-01-01 | 16000 | NON-OPERATING_EXPENSES | Facility | A | non-operating expenses | E |
| 7 | Apple Inc. | 1900-01-01 | 17000 | NON-OPERATING_EXPENSES | Supply | A | non-operating expenses | E |
| 8 | Apple Inc. | 1900-01-01 | 18000 | NON-OPERATING_EXPENSES | Services | A | non-operating expenses | E |
| 9 | Apple Inc. | 1900-01-01 | 19000 | NON-OPERATING_EXPENSES | Investment | A | non-operating expenses | E |
| 10 | Apple Inc. | 1900-01-01 | 20000 | NON-OPERATING_EXPENSES | Misc. | A | non-operating expenses | E |
| 11 | Apple Inc. | 1900-01-01 | 21000 | ASSETS | Depreciation | A | assets | A |
| 12 | Apple Inc. | 1900-01-01 | 22000 | ASSETS | Gain | A | assets | A |
| 13 | Apple Inc. | 1900-01-01 | 23000 | ASSETS | Service | A | assets | A |
| 14 | Apple Inc. | 1900-01-01 | 24000 | ASSETS | Retired | A | assets | A |
| 15 | Apple Inc. | 1900-01-01 | 25000 | ASSETS | Fault. | A | assets | A |
| 16 | Apple Inc. | 1900-01-01 | 26000 | LIABILITIES | Receipt | A | liability | L |
| 17 | Apple Inc. | 1900-01-01 | 27000 | LIABILITIES | Accrual | A | liability | L |
| 18 | Apple Inc. | 1900-01-01 | 28000 | LIABILITIES | Return | A | liability | L |
| 19 | Apple Inc. | 1900-01-01 | 29000 | LIABILITIES | Credit | A | liability | L |
| 20 | Apple Inc. | 1900-01-01 | 30000 | LIABILITIES | ROI | A | liability | L |
| 21 | Apple Inc. | 1900-01-01 | 31000 | NET_WORTH | Cash | A | net-worth | N |
| 22 | Apple Inc. | 1900-01-01 | 32000 | NET_WORTH | Funds | A | net-worth | N |
| 23 | Apple Inc. | 1900-01-01 | 33000 | NET_WORTH | Invest | A | net-worth | N |
| 24 | Apple Inc. | 1900-01-01 | 34000 | NET_WORTH | Transfer | A | net-worth | N |
| 25 | Apple Inc. | 1900-01-01 | 35000 | NET_WORTH | Roll-over | A | net-worth | N |
| 26 | Apple Inc. | 1900-01-01 | 36000 | STATISTICS | FTE | A | stats | S |
| 27 | Apple Inc. | 1900-01-01 | 37000 | STATISTICS | Members | A | stats | S |
| 28 | Apple Inc. | 1900-01-01 | 38000 | STATISTICS | Non_Members | A | stats | S |
| 29 | Apple Inc. | 1900-01-01 | 39000 | STATISTICS | Temp | A | stats | S |
| 30 | Apple Inc. | 1900-01-01 | 40000 | STATISTICS | Contractors | A | stats | S |
| 31 | Apple Inc. | 1900-01-01 | 41000 | REVENUE | Sales | A | revenue | R |
| 32 | Apple Inc. | 1900-01-01 | 42000 | REVENUE | Merchant | A | revenue | R |
| 33 | Apple Inc. | 1900-01-01 | 43000 | REVENUE | Service | A | revenue | R |
| 34 | Apple Inc. | 1900-01-01 | 44000 | REVENUE | Consulting | A | revenue | R |
| 35 | Apple Inc. | 1900-01-01 | 45000 | REVENUE | Subscriptions | A | revenue | R |
Categorical and Pooled Arrays as name suggests, are data structure to store voluminous data efficiently,specially when a column in a data frame has small number of distinct values (aka levels), repeated across entire column vector.
as an example, Finance Ledger may have millions of transactions and every row has one of these seven type of accounts. It's not recommended to store repeating value of entire string in every row. Instead, using a Categorical or PooledArray data type, memory/data size can be significantly reduced with out losing any data quality. (size(..) stays same for original, Categorical and PooledArray data type.
as you can see in above example, size of categorical / pooled array data type matches with original column vector but significantly reduces size/memory of data. (Base.summarysize(...)) is reduced 50% and is further reduced by 85% if used with compress(...))
Using Categorical Array type over PooledArray is recommended when there are fewer unique values, user need meaningful ordering and grouping. On the other hand, PoolArray is preferred when small memory usage is needed.
Department chartfield
using DataFrames
## create Accounts chartfield
# DEPARTMENT Chartfield
deptDF = DataFrame(
    AS_OF_DATE=Date("2000-01-01", dateformat"y-m-d"),
    ID = 1100:100:1500,
    CLASSIFICATION=["SALES","HR", "IT","BUSINESS","OTHERS"],
    CATEGORY=["sales","human_resource","IT_Staff","business","others"],
    STATUS="A",
    DESCR=[
    "Sales & Marketing","Human Resource","Infomration Technology","Business leaders","other temp"
        ],
    DEPT_TYPE=["S","H","I","B","O"]);
size(deptDF),deptDF[collect(1:5),:]
Location chartfield
using DataFrames
locationDF = DataFrame(
    AS_OF_DATE=Date("2000-01-01", dateformat"y-m-d"),
    ID = 11:1:22,
    CLASSIFICATION=repeat([
        "Region A","Region B", "Region C"], inner=4),
    CATEGORY=repeat([
        "Region A","Region B", "Region C"], inner=4),
    STATUS="A",
    DESCR=[
"Boston","New York","Philadelphia","Cleveland","Richmond",
"Atlanta","Chicago","St. Louis","Minneapolis","Kansas City",
"Dallas","San Francisco"],
    LOC_TYPE="Physical");
locationDF[:,:]
Ledger FACT
## pu
using DataFrames, Dates
accountsDF = DataFrame(
    ENTITY = "Apple Inc.",
    AS_OF_DATE=Date("1900-01-01", dateformat"y-m-d"),
    ID = 11000:1000:45000,
    CLASSIFICATION=repeat([
        "OPERATING_EXPENSES","NON-OPERATING_EXPENSES", "ASSETS","LIABILITIES","NET_WORTH","STATISTICS","REVENUE"
                ], inner=5),
    CATEGORY=[
        "Travel","Payroll","non-Payroll","Allowance","Cash",
        "Facility","Supply","Services","Investment","Misc.",
        "Depreciation","Gain","Service","Retired","Fault.",
        "Receipt","Accrual","Return","Credit","ROI",
        "Cash","Funds","Invest","Transfer","Roll-over",
        "FTE","Members","Non_Members","Temp","Contractors",
        "Sales","Merchant","Service","Consulting","Subscriptions"],
    STATUS="A",
    DESCR=repeat([
    "operating expenses","non-operating expenses","assets","liability","net-worth","stats","revenue"], inner=5),
    ACCOUNT_TYPE=repeat(["E","E","A","L","N","S","R"],inner=5))
# DEPARTMENT Chartfield
deptDF = DataFrame(
    AS_OF_DATE=Date("2000-01-01", dateformat"y-m-d"),
    ID = 1100:100:1500,
    CLASSIFICATION=["SALES","HR", "IT","BUSINESS","OTHERS"],
    CATEGORY=["sales","human_resource","IT_Staff","business","others"],
    STATUS="A",
    DESCR=[
    "Sales & Marketing","Human Resource","Infomration Technology","Business leaders","other temp"
        ],
    DEPT_TYPE=["S","H","I","B","O"]);
size(deptDF),deptDF[collect(1:5),:]

locationDF = DataFrame(
    AS_OF_DATE=Date("2000-01-01", dateformat"y-m-d"),
    ID = 11:1:22,
    CLASSIFICATION=repeat([
        "Region A","Region B", "Region C"], inner=4),
    CATEGORY=repeat([
        "Region A","Region B", "Region C"], inner=4),
    STATUS="A",
    DESCR=[
"Boston","New York","Philadelphia","Cleveland","Richmond",
"Atlanta","Chicago","St. Louis","Minneapolis","Kansas City",
"Dallas","San Francisco"],
    LOC_TYPE="Physical");
locationDF[:,:]

# creating Ledger
ledgerDF = DataFrame(
            LEDGER = String[], FISCAL_YEAR = Int[], PERIOD = Int[], ORGID = String[],
            OPER_UNIT = String[], ACCOUNT = Int[], DEPT = Int[], LOCATION = Int[],
            POSTED_TOTAL = Float64[]
            );

# create 2020 Period 1-12 Actuals Ledger
l = "Actuals";
fy = 2020;
for p = 1:12
    for i = 1:10^5
        push!(ledgerDF, (l, fy, p, "ABC Inc.", rand(locationDF.CATEGORY),
            rand(accountsDF.ID), rand(deptDF.ID), rand(locationDF.ID), rand()*10^8))
    end
end

# create 2021 Period 1-4 Actuals Ledger
l = "Actuals";
fy = 2021;
for p = 1:4
    for i = 1:10^5
        push!(ledgerDF, (l, fy, p, "ABC Inc.", rand(locationDF.CATEGORY),
            rand(accountsDF.ID), rand(deptDF.ID), rand(locationDF.ID), rand()*10^8))
    end
end

# create 2021 Period 1-4 Budget Ledger
l = "Budget";
fy = 2021;
for p = 1:12
    for i = 1:10^5
        push!(ledgerDF, (l, fy, p, "ABC Inc.", rand(locationDF.CATEGORY),
            rand(accountsDF.ID), rand(deptDF.ID), rand(locationDF.ID), rand()*10^8))
    end
end

# here is ~3 million rows ledger dataframe
first(ledgerDF,5)
5 rows × 9 columns
| LEDGER | FISCAL_YEAR | PERIOD | ORGID | OPER_UNIT | ACCOUNT | DEPT | LOCATION | POSTED_TOTAL | |
|---|---|---|---|---|---|---|---|---|---|
| String | Int64 | Int64 | String | String | Int64 | Int64 | Int64 | Float64 | |
| 1 | Actuals | 2020 | 1 | ABC Inc. | Region A | 38000 | 1200 | 22 | 7.85632e7 |
| 2 | Actuals | 2020 | 1 | ABC Inc. | Region A | 33000 | 1500 | 15 | 5.4957e7 |
| 3 | Actuals | 2020 | 1 | ABC Inc. | Region B | 18000 | 1300 | 14 | 3.32866e7 |
| 4 | Actuals | 2020 | 1 | ABC Inc. | Region A | 43000 | 1200 | 16 | 9.49366e7 |
| 5 | Actuals | 2020 | 1 | ABC Inc. | Region A | 41000 | 1300 | 22 | 4.79162e7 |
Supply chain data model
you will need following packages.
using Pkg
Pkg.add("DataFrames")
Pkg.add("Dates")
Pkg.add("CategoricalArrays")
Pkg.add("Interact")
Pkg.add("WebIO")
Pkg.add("CSV")
Pkg.add("XLSX")
Pkg.add("DelimitedFiles")
Pkg.add("Distributions")
Pkg.build("WebIO")
Pkg.status();

using DataFrames, Dates, Interact, CategoricalArrays, WebIO, CSV, XLSX, DelimitedFiles, Distributions
Resolving package versions...
No Changes to `~/.julia/environments/v1.7/Project.toml`
No Changes to `~/.julia/environments/v1.7/Manifest.toml`
Resolving package versions...
No Changes to `~/.julia/environments/v1.7/Project.toml`
No Changes to `~/.julia/environments/v1.7/Manifest.toml`
Resolving package versions...
No Changes to `~/.julia/environments/v1.7/Project.toml`
No Changes to `~/.julia/environments/v1.7/Manifest.toml`
Resolving package versions...
No Changes to `~/.julia/environments/v1.7/Project.toml`
No Changes to `~/.julia/environments/v1.7/Manifest.toml`
Resolving package versions...
No Changes to `~/.julia/environments/v1.7/Project.toml`
No Changes to `~/.julia/environments/v1.7/Manifest.toml`
Resolving package versions...
No Changes to `~/.julia/environments/v1.7/Project.toml`
No Changes to `~/.julia/environments/v1.7/Manifest.toml`
Resolving package versions...
No Changes to `~/.julia/environments/v1.7/Project.toml`
No Changes to `~/.julia/environments/v1.7/Manifest.toml`
Resolving package versions...
No Changes to `~/.julia/environments/v1.7/Project.toml`
No Changes to `~/.julia/environments/v1.7/Manifest.toml`
Resolving package versions...
No Changes to `~/.julia/environments/v1.7/Project.toml`
No Changes to `~/.julia/environments/v1.7/Manifest.toml`
Building WebIO → `~/.julia/scratchspaces/44cfe95a-1eb2-52ea-b672-e2afdf69b78f/a8bbcd0b08061bba794c56fb78426e96e114ae7f/build.log`
Status `~/.julia/environments/v1.7/Project.toml`
[336ed68f] CSV v0.10.4
[54eefc05] Cascadia v1.0.2
[324d7699] CategoricalArrays v0.10.6
[8f4d0f93] Conda v1.7.0
[a93c6f00] DataFrames v1.3.4
[31c24e10] Distributions v0.25.64
[e30172f5] Documenter v0.27.19
[8f5d6c58] EzXML v1.1.0
[708ec375] Gumbo v0.8.1
[cd3eb016] HTTP v0.9.17
[7073ff75] IJulia v1.23.3
[c601a237] Interact v0.10.4
[0f8b85d8] JSON3 v1.9.5
[b9914132] JSONTables v1.0.3
[4d0d745f] PDFIO v0.1.13
[c3e4b0f8] Pluto v0.19.9
[2dfb63ee] PooledArrays v1.4.2
[438e738f] PyCall v1.93.1
[88034a9c] StringDistances v0.11.2
[a2db99b7] TextAnalysis v0.7.3
[05625dda] WebDriver v0.1.2
[0f1e0344] WebIO v0.8.18
[fdbf4ff8] XLSX v0.7.10
[ade2ca70] Dates
[8bb1440f] DelimitedFilesrest of this blog, I will assume, you have added all packages and imported in current namespace/notebook scope.
Supply Chain Data
We already covered DataFrames and ERP Finance data model in previous sections. in below section, let's recreate all Supply Chain DataFrames to continue advance analytics and visualization.
All of Finance and supply chain data discussed here is also uploaded in GitHub repo under sampleData folder. This same script can be used to produce more voluminous data.
Dimensions
Item master, Item Attribs, Item Costing
UNSPSC: The United Nations Standard Products and Services Code® (UNSPSC®) is a global classification system of products and services. These codes are used to classify products and services.
GUDID: The Global Unique Device Identification Database (GUDID) is a database administered by the FDA that will serve as a reference catalog for every device with a unique device identifier (UDI).
GTIN: Global Trade Item Number (GTIN) can be used by a company to uniquely identify all of its trade items. GS1 defines trade items as products or services that are priced, ordered or invoiced at any point in the supply chain.
GMDN: The Global Medical Device Nomenclature (GMDN) is a comprehensive set of terms, within a structured category hierarchy, which name and group ALL medical device products including implantables, medical equipment, consumables, and diagnostic devices.
Vendor master, Vendor Attribs, Vendor Costing Customer/Buyer/Procurement Officer Attribs shipto, warehouse, storage & inventory locations
Transactions
- PurchaseOrder
- MSR - Material Service
- Voucher
- Invoice
- Receipt
- Shipment
- Sales, Revenue
- Travel, Expense, TimeCard
- Accounting Lines
Item Master
import Pkg
Pkg.add("XLSX")
Pkg.add("CSV")
using XLSX, CSV, DataFrames
###############################
## create SUPPLY CHAIN DATA ###
###############################
# Item master, Item Attribs, Item Costing ##
#       UNSPSC, GUDID, GTIN, GMDN
############################################

##########
# UNSPSC #
##########
# UNSPSC file can be downloaded from this link https://www.ungm.org/Public/UNSPSC
# xf = XLSX.readxlsx("assets/sampleData/UNGM_UNSPSC_09-Apr-2022..xlsx")
# xf will display names of sheets and rows with data
# let's read this data in to a DataFrame

# using below command will read xlsx data into DataFrame but will not render column labels
# df = DataFrame(XLSX.readdata("assets/sampleData/UNGM_UNSPSC_09-Apr-2022..xlsx", "UNSPSC", "A1:D12988"), :auto)
# dfUNSPSC = DataFrame(XLSX.readtable("assets/sampleData/UNGM_UNSPSC_09-Apr-2022..xlsx", "UNSPSC")...)
# ... operator will splat the tuple (data, column_labels) into the constructor of DataFrame

# replace missing values with an integer 99999
# replace!(dfUNSPSC."Parent key", missing => 99999)

# let's export this clean csv, we'll load this into database
# CSV.write("UNSPSC.csv", dfUNSPSC)

# # remember to empty dataFrame after usage
# # Julia will flush it out automatically after session,
# # but often ERP data gets bulky during session
# Base.summarysize(dfUNSPSC)
# empty!(dfUNSPSC)
# Base.summarysize(dfUNSPSC)

# first(dfUNSPSC, 5)
Resolving package versions...
No Changes to `~/.julia/environments/v1.7/Project.toml`
No Changes to `~/.julia/environments/v1.7/Manifest.toml`
Resolving package versions...
No Changes to `~/.julia/environments/v1.7/Project.toml`
No Changes to `~/.julia/environments/v1.7/Manifest.toml`GUDID Database
using DataFrames, Dates, Interact, CategoricalArrays, WebIO, CSV, XLSX, DelimitedFiles, Distributions
##########
# GUDID ##
##########
# The complete list of GUDID Data Elements and descriptions can be found at this link.
# https://www.fda.gov/media/120974/download
# The complete GUDID Database (delimited version) download (250+MB)
# https://accessgudid.nlm.nih.gov/release_files/download/AccessGUDID_Delimited_Full_Release_20220401.zip
# let's extract all GUDID files in a folder
# readdir(pwd())
# readdir("assets/sampleData/GUDID")
# since these files are in txt (delimited) format, we'll use delimited pkg

########################
## large txt files #####
## read one at a time ##
########################

# data, header = readdlm("assets/sampleData/GUDID/contacts.txt", '|', header=true)
# dfGUDIDcontacts = DataFrame(data, vec(header))

# data, header = readdlm("assets/sampleData/GUDID/identifiers.txt", '|', header=true)
# dfGUDIDidentifiers = DataFrame(data, vec(header))

# data, header = readdlm("assets/sampleData/GUDID/device.txt", '|', header=true)
# dfGUDIDdevice = DataFrame(data, vec(header))

# # remember to empty dataFrame after usage
# # Julia will flush it out automatically after session,
# # but often ERP data gets bulky during session
# Base.summarysize(dfGUDIDcontacts),Base.summarysize(dfGUDIDidentifiers),Base.summarysize(dfGUDIDdevice)
# empty!(dfGUDIDcontacts)
# empty!(dfGUDIDidentifiers)
# empty!(dfGUDIDdevice)
# Base.summarysize(dfGUDIDcontacts),Base.summarysize(dfGUDIDidentifiers),Base.summarysize(dfGUDIDdevice)
using DataFrames, Dates, Interact, CategoricalArrays, WebIO, CSV, XLSX, DelimitedFiles, Distributions
##########
# GTIN ###
##########
# xf = XLSX.readxlsx("assets/sampleData/DS_GTIN_ALL.xlsx")
# xf will display names of sheets and rows with data
# let's read this data in to a DataFrame
# using below command will read xlsx data into DataFrame but will not render column labels
# df = DataFrame(XLSX.readdata("assets/sampleData/DS_GTIN_ALL.xlsx", "Worksheet", "A14:E143403 "), :auto)
# dfGTIN = DataFrame(XLSX.readtable("assets/sampleData/DS_GTIN_ALL.xlsx", "Worksheet";first_row=14)...)
# ... operator will splat the tuple (data, column_labels) into the constructor of DataFrame
# replace missing values with an integer 99999
# replace!(dfUNSPSC."Parent key", missing => 99999)
# size(dfUNSPSC)
# let's export this clean csv, we'll load this into database
# CSV.write("UNSPSC.csv", dfUNSPSC)
# readdir(pwd())
# # remember to empty dataFrame after usage
# # Julia will flush it out automatically after session,
# # but often ERP data gets bulky during session
# Base.summarysize(dfGTIN)
# empty!(dfGTIN)
# Base.summarysize(dfGTIN)using DataFrames, Dates, Interact, CategoricalArrays, WebIO, CSV, XLSX, DelimitedFiles, Distributions
##########
# GMDN ###
##########
## GMDN data is not available
# # remember to empty dataFrame after usage
# # Julia will flush it out automatically after session,
# # but often ERP data gets bulky during session
# Base.summarysize(dfGMDN)
# empty!(dfGMDN)
# Base.summarysize(dfGMDN)Vendor Master
using DataFrames, Dates, Interact, CategoricalArrays, WebIO, CSV, XLSX, DelimitedFiles, Distributions
#################
# Vendor master #
#################
# data, header = readdlm("assets/sampleData/GUDID/device.txt", '|', header=true)
# dfGUDIDdevice = DataFrame(data, vec(header))
# create Vendor Master from GUDID dataset
# show(first(dfGUDIDdevice,5), allcols=true)
# show(first(dfGUDIDdevice[:,[:brandName, :catalogNumber, :dunsNumber, :companyName, :rx, :otc]],5), allcols=true)
# names(dfGUDIDdevice)
# dfVendor = unique(dfGUDIDdevice[:,[:brandName, :catalogNumber, :dunsNumber, :companyName, :rx, :otc]])
# dfVendor = unique(dfGUDIDdevice[:,[:companyName]]) # 7574 unique vendors

# dfVendor = unique(dfGUDIDdevice[:,[:brandName, :dunsNumber, :companyName, :rx, :otc]])
# dfVendor is a good dataset, have 216k rows for 7574 unique vendors

# # remember to empty dataFrame after usage
# # Julia will flush it out automatically after session,
# # but often ERP data gets bulky during session
# Base.summarysize(dfVendor)
# empty!(dfVendor)
# Base.summarysize(dfVendor)
using DataFrames, Dates, Interact, CategoricalArrays, WebIO, CSV, XLSX, DelimitedFiles, Distributions
#### Location Master
# data, header = readdlm("assets/sampleData/uscities.csv", ',', header=true)
# dfLocation = DataFrame(data, vec(header))
# # remember to empty dataFrame after usage
# # Julia will flush it out automatically after session,
# # but often ERP data gets bulky during session
# Base.summarysize(dfLocation)
# empty!(dfLocation)
# Base.summarysize(dfLocation)using DataFrames, Dates, Interact, CategoricalArrays, WebIO, CSV, XLSX, DelimitedFiles, Distributions
dfOrgMaster = DataFrame(
ENTITY=repeat(["HeadOffice"], inner=8),
GROUP=repeat(["Operations"], inner=8),
DEPARTMENT=["Procurement","Procurement","Procurement","Procurement","Procurement","HR","HR","MFG"],
UNIT=["Sourcing","Sourcing","Maintenance","Support","Services","Helpdesk","ServiceCall","IT"])8 rows × 4 columns
| ENTITY | GROUP | DEPARTMENT | UNIT | |
|---|---|---|---|---|
| String | String | String | String | |
| 1 | HeadOffice | Operations | Procurement | Sourcing |
| 2 | HeadOffice | Operations | Procurement | Sourcing |
| 3 | HeadOffice | Operations | Procurement | Maintenance |
| 4 | HeadOffice | Operations | Procurement | Support |
| 5 | HeadOffice | Operations | Procurement | Services |
| 6 | HeadOffice | Operations | HR | Helpdesk |
| 7 | HeadOffice | Operations | HR | ServiceCall |
| 8 | HeadOffice | Operations | MFG | IT |
creating complete Supply Chain Data Model DataFrames
now since we created Supply chain attribute, chartfields / dimensions
- item master
- vendor master
- location master
- org Hierarchy
using above chartfields, let's create following Supply Chain Transactions
- MSR - Material Service request
- PurchaseOrder
- Voucher
- Invoice
- Receipt
- Shipment
- Sales, Revenue
- Travel, Expense, TimeCard
- Accounting Lines
MSR - Material Service request
using DataFrames, Dates, Interact, CategoricalArrays, WebIO, CSV, XLSX, DelimitedFiles, Distributions
sampleSize = 1000 # number of rows, scale as needed

# data, header = readdlm("assets/sampleData/GUDID/device.txt", '|', header=true)
# df GUDIDdevice = DataFrame(data, vec(header))
# dfVendor = unique(dfGUDIDdevice[:,[:brandName, :dunsNumber, :companyName, :rx, :otc]])
# data, header = readdlm("assets/sampleData/uscities.csv", ',', header=true)
# dfLocation = DataFrame(data, vec(header))
# dfOrgMaster = DataFrame(
#    ENTITY=repeat(["HeadOffice"], inner=8),
#    GROUP=repeat(["Operations"], inner=8),
#    DEPARTMENT=["Procurement","Procurement","Procurement","Procurement","Procurement","HR","HR","MFG"],
#    UNIT=["Sourcing","Sourcing","Maintenance","Support","Services","Helpdesk","ServiceCall","IT"])

# dfMSR = DataFrame(
#    UNIT = rand(dfOrgMaster.UNIT, sampleSize),
#    MSR_DATE=rand(collect(Date(2020,1,1):Day(1):Date(2022,5,1)), sampleSize),
#    FROM_UNIT = rand(dfOrgMaster.UNIT, sampleSize),
#    TO_UNIT = rand(dfOrgMaster.UNIT, sampleSize),
#    GUDID = rand(dfGUDIDdevice.PrimaryDI, sampleSize),
#    QTY = rand(dfOrgMaster.UNIT, sampleSize));
# first(dfMSR, 5)1000PO - Purchase Order
using DataFrames, Dates, Interact, CategoricalArrays, WebIO, CSV, XLSX, DelimitedFiles, Distributions
sampleSize = 1000 # number of rows, scale as needed

# data, header = readdlm("assets/sampleData/GUDID/device.txt", '|', header=true)
# dfGUDIDdevice = DataFrame(data, vec(header))
# dfVendor = unique(dfGUDIDdevice[:,[:brandName, :dunsNumber, :companyName, :rx, :otc]])
# data, header = readdlm("assets/sampleData/uscities.csv", ',', header=true)
# dfLocation = DataFrame(data, vec(header))
dfOrgMaster = DataFrame(
    ENTITY=repeat(["HeadOffice"], inner=8),
    GROUP=repeat(["Operations"], inner=8),
    DEPARTMENT=["Procurement","Procurement","Procurement","Procurement","Procurement","HR","HR","MFG"],
    UNIT=["Sourcing","Sourcing","Maintenance","Support","Services","Helpdesk","ServiceCall","IT"]);

# dfPO = DataFrame(
#    UNIT = rand(dfOrgMaster.UNIT, sampleSize),
#    PO_DATE=rand(collect(Date(2020,1,1):Day(1):Date(2022,5,1)), sampleSize),
#    VENDOR=rand(unique(dfVendor.companyName), sampleSize),
#    GUDID = rand(dfGUDIDdevice.PrimaryDI, sampleSize),
#    QTY = rand(1:150, sampleSize),
#    UNIT_PRICE = rand(Normal(100, 2), sampleSize)
#    );
# show(first(dfPO, 5),allcols=true)
8 rows × 4 columns
| ENTITY | GROUP | DEPARTMENT | UNIT | |
|---|---|---|---|---|
| String | String | String | String | |
| 1 | HeadOffice | Operations | Procurement | Sourcing |
| 2 | HeadOffice | Operations | Procurement | Sourcing |
| 3 | HeadOffice | Operations | Procurement | Maintenance |
| 4 | HeadOffice | Operations | Procurement | Support |
| 5 | HeadOffice | Operations | Procurement | Services |
| 6 | HeadOffice | Operations | HR | Helpdesk |
| 7 | HeadOffice | Operations | HR | ServiceCall |
| 8 | HeadOffice | Operations | MFG | IT |
Invoice - Voucher Invoice
using DataFrames, Dates, Interact, CategoricalArrays, WebIO, CSV, XLSX, DelimitedFiles, Distributions

sampleSize = 1000 # number of rows, scale as needed

# data, header = readdlm("assets/sampleData/GUDID/device.txt", '|', header=true)
# dfGUDIDdevice = DataFrame(data, vec(header))
# dfVendor = unique(dfGUDIDdevice[:,[:brandName, :dunsNumber, :companyName, :rx, :otc]])
# data, header = readdlm("assets/sampleData/uscities.csv", ',', header=true)
# dfLocation = DataFrame(data, vec(header))
dfOrgMaster = DataFrame(
    ENTITY=repeat(["HeadOffice"], inner=8),
    GROUP=repeat(["Operations"], inner=8),
    DEPARTMENT=["Procurement","Procurement","Procurement","Procurement","Procurement","HR","HR","MFG"],
    UNIT=["Sourcing","Sourcing","Maintenance","Support","Services","Helpdesk","ServiceCall","IT"]);

# dfVCHR = DataFrame(
#    UNIT = rand(dfOrgMaster.UNIT, sampleSize),
#    VCHR_DATE=rand(collect(Date(2020,1,1):Day(1):Date(2022,5,1)), sampleSize),
#    STATUS=rand(["Closed","Paid","Open","Cancelled","Exception"], sampleSize),
#    VENDOR_INVOICE_NUM = rand(10001:9999999, sampleSize),
#    VENDOR=rand(unique(dfVendor.companyName), sampleSize),
#    GUDID = rand(dfGUDIDdevice.PrimaryDI, sampleSize),
#    QTY = rand(1:150, sampleSize),
#    UNIT_PRICE = rand(Normal(100, 2), sampleSize)
#    );
# show(first(dfVCHR, 5),allcols=true)
8 rows × 4 columns
| ENTITY | GROUP | DEPARTMENT | UNIT | |
|---|---|---|---|---|
| String | String | String | String | |
| 1 | HeadOffice | Operations | Procurement | Sourcing |
| 2 | HeadOffice | Operations | Procurement | Sourcing |
| 3 | HeadOffice | Operations | Procurement | Maintenance |
| 4 | HeadOffice | Operations | Procurement | Support |
| 5 | HeadOffice | Operations | Procurement | Services |
| 6 | HeadOffice | Operations | HR | Helpdesk |
| 7 | HeadOffice | Operations | HR | ServiceCall |
| 8 | HeadOffice | Operations | MFG | IT |
Sales - Revenue Register
using DataFrames, Dates, Interact, CategoricalArrays, WebIO, CSV, XLSX, DelimitedFiles, Distributions
sampleSize = 1000 # number of rows, scale as needed

# data, header = readdlm("assets/sampleData/GUDID/device.txt", '|', header=true)
# dfGUDIDdevice = DataFrame(data, vec(header))
# dfVendor = unique(dfGUDIDdevice[:,[:brandName, :dunsNumber, :companyName, :rx, :otc]])
# data, header = readdlm("assets/sampleData/uscities.csv", ',', header=true)
# dfLocation = DataFrame(data, vec(header))
dfOrgMaster = DataFrame(
    ENTITY=repeat(["HeadOffice"], inner=8),
    GROUP=repeat(["Operations"], inner=8),
    DEPARTMENT=["Procurement","Procurement","Procurement","Procurement","Procurement","HR","HR","MFG"],
    UNIT=["Sourcing","Sourcing","Maintenance","Support","Services","Helpdesk","ServiceCall","IT"]);

# dfREVENUE = DataFrame(
#    UNIT = rand(dfOrgMaster.UNIT, sampleSize),
#    SALES_DATE=rand(collect(Date(2020,1,1):Day(1):Date(2022,5,1)), sampleSize),
#    STATUS=rand(["Sold","Pending","Hold","Cancelled","Exception"], sampleSize),
#    SALES_RECEIPT_NUM = rand(10001:9999999, sampleSize),
#    CUSTOMER=rand(unique(dfVendor.companyName), sampleSize),
#    GUDID = rand(dfGUDIDdevice.PrimaryDI, sampleSize),
#    QTY = rand(1:150, sampleSize),
#    UNIT_PRICE = rand(Normal(100, 2), sampleSize)
#    );
# show(first(dfREVENUE, 5),allcols=true)
8 rows × 4 columns
| ENTITY | GROUP | DEPARTMENT | UNIT | |
|---|---|---|---|---|
| String | String | String | String | |
| 1 | HeadOffice | Operations | Procurement | Sourcing |
| 2 | HeadOffice | Operations | Procurement | Sourcing |
| 3 | HeadOffice | Operations | Procurement | Maintenance |
| 4 | HeadOffice | Operations | Procurement | Support |
| 5 | HeadOffice | Operations | Procurement | Services |
| 6 | HeadOffice | Operations | HR | Helpdesk |
| 7 | HeadOffice | Operations | HR | ServiceCall |
| 8 | HeadOffice | Operations | MFG | IT |
Shipment - Receipt
using DataFrames, Dates, Interact, CategoricalArrays, WebIO, CSV, XLSX, DelimitedFiles, Distributions
sampleSize = 1000 # number of rows, scale as needed

# data, header = readdlm("assets/sampleData/GUDID/device.txt", '|', header=true)
# dfGUDIDdevice = DataFrame(data, vec(header))
# dfVendor = unique(dfGUDIDdevice[:,[:brandName, :dunsNumber, :companyName, :rx, :otc]])
# data, header = readdlm("assets/sampleData/uscities.csv", ',', header=true)
# dfLocation = DataFrame(data, vec(header))
dfOrgMaster = DataFrame(
    ENTITY=repeat(["HeadOffice"], inner=8),
    GROUP=repeat(["Operations"], inner=8),
    DEPARTMENT=["Procurement","Procurement","Procurement","Procurement","Procurement","HR","HR","MFG"],
    UNIT=["Sourcing","Sourcing","Maintenance","Support","Services","Helpdesk","ServiceCall","IT"])

# dfSHIPRECEIPT = DataFrame(
#    UNIT = rand(dfOrgMaster.UNIT, sampleSize),
#    SHIP_DATE=rand(collect(Date(2020,1,1):Day(1):Date(2022,5,1)), sampleSize),
#    STATUS=rand(["Shippped","Returned","In process","Cancelled","Exception"], sampleSize),
#    SHIPMENT_NUM = rand(10001:9999999, sampleSize),
#    CUSTOMER=rand(unique(dfVendor.companyName), sampleSize),
#    GUDID = rand(dfGUDIDdevice.PrimaryDI, sampleSize),
#    QTY = rand(1:150, sampleSize),
#    UNIT_PRICE = rand(Normal(100, 2), sampleSize)
#    );
# show(first(dfSHIPRECEIPT, 5),allcols=true)
8 rows × 4 columns
| ENTITY | GROUP | DEPARTMENT | UNIT | |
|---|---|---|---|---|
| String | String | String | String | |
| 1 | HeadOffice | Operations | Procurement | Sourcing |
| 2 | HeadOffice | Operations | Procurement | Sourcing |
| 3 | HeadOffice | Operations | Procurement | Maintenance |
| 4 | HeadOffice | Operations | Procurement | Support |
| 5 | HeadOffice | Operations | Procurement | Services |
| 6 | HeadOffice | Operations | HR | Helpdesk |
| 7 | HeadOffice | Operations | HR | ServiceCall |
| 8 | HeadOffice | Operations | MFG | IT |